 (2)
(2)
Math 37 - Lecture 6
Describing Data Examples
With your partner, on a separate piece of paper, answer the questions given in italics, to be turned in at the end of the lecture.
Example 1 Examine the dotplots of exam scores for 12 courses
- Have one partner describe the general shape of the graphs for Classes A-L to the other partner in as few as words possible. The listener will sketch graphs corresponding to the description, then record the description given.
- What was the fewest number of words you ever used?
- What were the most distinctive features among the 12 graphs?
Example 2 The following is a sample of times (rounded to minutes) between eruptions of the "Old Faithful" geyser at Yellowstone National Park in August 1985. The data have also been sorted:
|
42 |
45 |
49 |
50 |
50 |
51 |
51 |
51 |
51 |
53 |
53 |
55 |
55 |
|
55 |
56 |
56 |
57 |
57 |
58 |
60 |
66 |
67 |
67 |
68 |
68 |
68 |
|
69 |
70 |
70 |
71 |
71 |
72 |
72 |
73 |
73 |
73 |
74 |
74 |
74 |
|
75 |
75 |
75 |
75 |
75 |
76 |
76 |
76 |
76 |
76 |
76 |
77 |
78 |
|
78 |
79 |
79 |
80 |
80 |
80 |
80 |
81 |
82 |
82 |
82 |
83 |
83 |
|
83 |
84 |
84 |
84 |
85 |
86 |
86 |
86 |
88 |
90 |
91 |
93 |
95 |
(a) Have one person construct a stemplot of these data. Have the other person construct a split stemplot (e.g. the 4 stem will be split into 2 stems, the first stem gets leaves 0-4, the second gets leaves 5-9 and so on.) (Similarly, this is the difference between histograms with 10 and 5 as the interval widths...)
- Describe the shape and center of the distribution of times
- What is the consequence of splitting the stems?
- How long would you predict someone will have to wait between eruptions? Does it matter which picture you use to decide?
Example 3 - A marketing consultant observes 50 consecutive shoppers at a grocery store, recording how much each shopper spends in the store. Here are the data (in dollars, in order):
|
3.11 |
8.88 |
9.26 |
10.81 |
12.69 |
13.78 |
15.23 |
15.62 |
17.00 |
17.39 |
|
18.36 |
18.43 |
19.27 |
19.50 |
19.54 |
20.16 |
20.59 |
22.22 |
23.04 |
24.47 |
|
24.58 |
25.13 |
26.24 |
26.26 |
27.65 |
28.06 |
28.08 |
28.38 |
32.03 |
34.98 |
|
36.37 |
38.64 |
39.16 |
41.02 |
42.97 |
44.08 |
44.67 |
45.40 |
46.69 |
48.65 |
|
50.39 |
52.75 |
54.80 |
59.07 |
61.22 |
70.32 |
82.70 |
85.76 |
86.37 |
93.34 |
-What would you use for the stems?
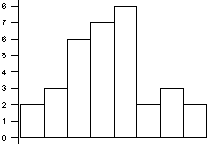
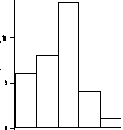
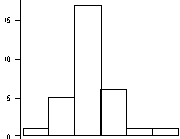
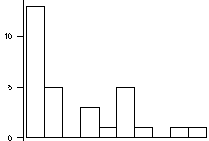
Example 4 - After the warm up example, match the following variables with the histograms given below, think about how each variable should behave. Thoroughly justify your choices. Include your classification of the shape of each distribution. (Section 1 data)
(a) Class's stated interest level in statistics on a scale of 1-5
(b) The height in inches of people in this class
(c) Number of siblings of individuals in this class
(d) Dollar amount spent on last haircut.
(e) Your guesses of my age
(1)  (2)
(2)
(3) 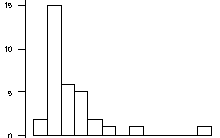 (4)
(4) 
(5) 
To turn in: Answers to the questions in italics, including your justifications of how you matched the graphs in Example 4. You don't need to turn in any graphs unless you have questions or illustrations.